By: Jason P. Huffman, CFP®, AAMS™, Financial Advisor
Data and policy actions cited are current as of May 11, 2026.
This is the first article in a four-part series analyzing the potential implications of the disruptions being created by the closing of the Strait of Hormuz. This article seeks to establish that fossil fuels are a materials platform with co-products embedded across the economy. The second article will analyzing the potential implications of the disruptions being created by the closing of the Strait of Hormuz.
Table of contents
Introduction
Energy, agriculture, healthcare, housing, logistics, and water infrastructure are typically analyzed as separate systems by separate disciplines with separate data sets. They are not separate. They share structural dependencies — common inputs, common vulnerabilities, common chokepoints — that become visible only when multiple systems come under stress at the same time.
That appears to be happening now. A geopolitical disruption in the Strait of Hormuz, an ongoing war between Russia and Ukraine, a record-breaking drought across the American West, a fiscal restructuring of the healthcare safety net in the US, a trade war reshaping agricultural export markets, and an immigration enforcement shift pulling labor from farms and construction sites are all unfolding simultaneously. Each is reported as its own story. Taken together, they reveal a set of connections that most conventional analysis misses — not because the information is hidden, but because the analytical frameworks that cover energy, agriculture, semiconductor manufacturing, and atmospheric science operate in separate institutional channels, publish for separate audiences, and draw on separate data. The individual analysts working within those channels may well understand that their domain connects to others. But the reports they produce, the formats they publish in, and the institutional mandates they serve compress that understanding out of the final product. The result is that the connections between systems — the shared dependencies that matter most under stress — exist in no single analytical product that reaches the public or the generalist decision-maker.
When the Strait of Hormuz closed in late February 2026, the immediate coverage focused on oil prices and gasoline. That framing captures one dimension of what was disrupted — and arguably not the most consequential one.
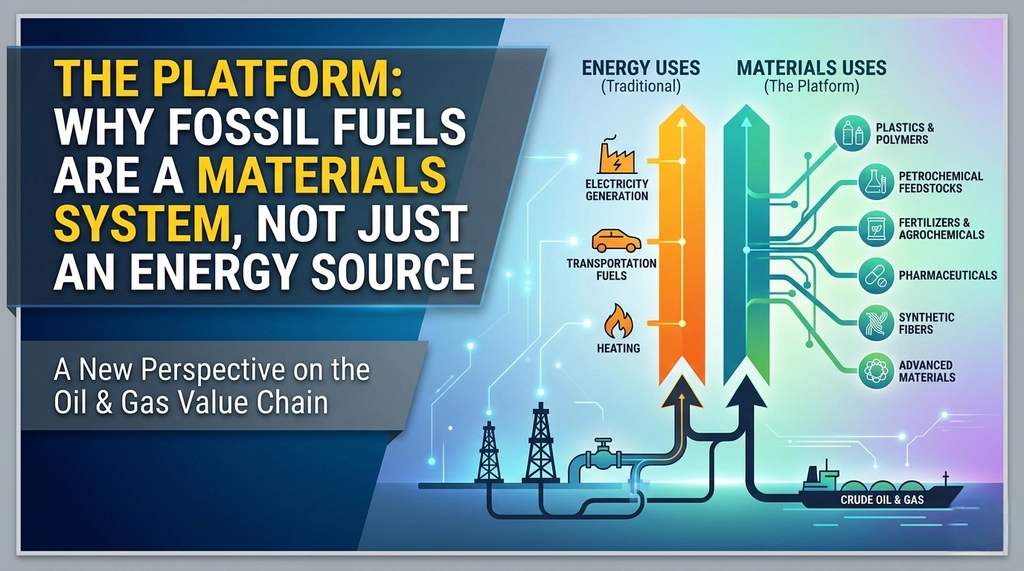
Fossil fuels are not just fuel. They are a platform technology — a production system whose outputs are structurally embedded in agriculture, medicine, construction, manufacturing, and thousands of consumer products. When that platform is disrupted, the consequences extend into domains that appear to have nothing to do with energy — because the molecular dependencies that connect them are invisible to most observers.
This article maps the platform. The rest of the series traces the chains.
The Blind Spots
The professional analysts who cover these domains operate within frameworks that generally fall into one of two patterns, each with a characteristic blind spot that is a product of the framework, not a failure of the person inside it.
The first is the big-picture generalist. They monitor a domain from 20,000 feet — global oil production by region, total barrels per day, potential new supply coming online, how hypothetical output changes might move the price of a benchmark barrel. This view is valuable but can obscure structural differences that only become visible at lower altitude. At 20,000 feet, a barrel is a barrel. At 10,000 feet, crude varies dramatically in density and sulfur content. At 5,000 feet, refineries are purpose-built for specific crude chemistries and cannot efficiently swap feedstocks. At 1,000 feet, those refineries aren’t always matched to the crude nearest them. The generalist who treats supply as fungible will misread a regional disruption as offset-able by production elsewhere — because at their altitude, the structural constraints that prevent that offset are invisible. They are also rarely tracking co-products — the helium, the petrochemical feedstocks, the fertilizer inputs — that emerge from the same extraction process as the commodity they monitor.
The second is the specialized domain expert. They see their own node at high resolution — a nitrogen fertilizer analyst, for instance, can tell you exactly what ammonia spot prices are doing, where urea contracts are headed, what the tariff schedule means for import costs. But their causal model terminates at the edge of their expertise. They can tell you fertilizer costs are rising. They typically cannot tell you that the corn farmer absorbing those costs was already leveraged from three consecutive loss years, that the planting decisions forced by that financial stress will alter feed grain supply eighteen months from now, that the resulting feed economics will trigger herd liquidation decisions in livestock, or that the corn acreage shortfall feeds back into ethanol blending and shows up at the gas pump. Each downstream link is someone else’s specialty. The full chain is nobody’s job.
The individual analyst may well understand that their domain connects to others. But the energy report goes to energy investors. The agricultural report goes to ag lenders. The semiconductor report goes to tech analysts. The information exists in separate streams — published in different outlets, briefing different audiences, drawing on different data — that do not converge in any product the public or a generalist decision-maker consumes.
Both blind spots are invisible during normal operations. The generalist’s aggregation works when supply has slack. The specialist’s truncated model works when stress stays isolated to one node. Both fail under the condition that defines the current moment: simultaneous stress across multiple systems, where the propagation paths between domains are carrying real consequences and nobody is mapping them end to end.
The Co-Product Architecture
When a refinery processes a barrel of crude oil, it does not produce a single product. The distillation column separates crude into fractions by boiling point, yielding gasoline, diesel, jet fuel, heating oil, lubricants, asphalt, petroleum coke, and a range of hydrocarbon feedstocks that enter the petrochemical supply chain. These outputs are not optional byproducts — they are co-products of a single integrated process. You cannot produce gasoline without simultaneously producing diesel, naphtha, and heavy residuals. The ratios can be adjusted within limits by refinery configuration, but they cannot be eliminated.
Natural gas undergoes a parallel process. It is burned for electricity and heating, but it also serves a function that most people outside industrial chemistry never encounter: it is the primary source of hydrogen used in the Haber-Bosch process, the industrial synthesis of ammonia that undergirds virtually all synthetic nitrogen fertilizer production worldwide. A molecule of methane used to heat a building or generate electricity is a molecule that is not available to be disassembled for fertilizer production. These are competing claims on the same supply — and when that supply contracts, every use is bidding against every other use for the same gas. The Haber-Bosch process does not burn natural gas for energy — it disassembles methane molecules for their hydrogen atoms, which are bonded with atmospheric nitrogen to create ammonia. The gas is not fuel in this reaction. It is a raw material. No renewable alternative currently exists that can produce hydrogen at the volume and cost necessary to sustain the fertilizer output that feeds the world’s current population.¹
The stakes of this dependency are difficult to overstate. A 2008 study published in Nature Geoscience estimated that without the Haber-Bosch process, the Earth could support roughly 3 to 4 billion people — approximately half the current global population.² Our World in Data’s subsequent analysis corroborated this, estimating that just under half of the global population is dependent on crops grown with synthetic nitrogen fertilizers.³ The process also consumes approximately 1–2% of global energy supply annually and accounts for roughly 1% of global CO₂ emissions on its own.
That dependency is now under direct stress. Iranian missile strikes on Qatar’s Ras Laffan Industrial City on March 2 forced QatarEnergy to halt LNG production and declare force majeure on all long-term supply contracts. The shutdown simultaneously took offline two of the company’s fourteen LNG trains — with an estimated 3–5 years of repair ahead — and halted downstream production of urea, polymers, methanol, and other petrochemical outputs. The closure of the Strait of Hormuz compounded the production shock with a logistics blockade: approximately one-third of the world’s basic fertilizer trade normally transits the strait, including roughly 21% of global urea trade and 15% of ammonia trade. The result has been a dual disruption — Gulf fertilizer producers cannot export, and non-Gulf producers who depend on imported natural gas feedstock face surging input costs. Fertilizer plants in India, Bangladesh, and Pakistan have shut down for lack of gas supply. Egyptian producers, cut off from Israeli gas imports, have been forced onto the spot LNG market at sharply elevated prices. Urea prices surged more than 28% within three weeks of the closure, with Egyptian granular urea — a bellwether for nitrogen markets — jumping from roughly $400–490/MT to $700/MT. The disruption hit at the worst possible moment: the beginning of Northern Hemisphere spring planting season, when farmers typically place their fertilizer orders.⁴
Helium — essential for semiconductor manufacturing, MRI machines, fiber optic production, and certain aerospace applications — is extracted almost exclusively as a byproduct of natural gas processing. Standalone helium drilling has historically been uneconomical, though rising prices and the current supply shortage are beginning to change that calculus — new exploration projects in Saskatchewan and Tanzania are among the first to pursue helium as a primary product rather than a byproduct. Roughly 75% of global helium supply has historically come from U.S. natural gas fields, with Qatar as the other major source.⁵
Qatar accounts for roughly 30% of global high-purity helium supply, all of it processed at Ras Laffan and all of it exported through the Strait of Hormuz. When LNG production stopped, helium production stopped with it — not because of helium market conditions, but because helium extraction is physically integrated with LNG processing. There is no way to produce one without the other. Airgas, a major U.S. helium distributor, declared force majeure and restricted customers to 50% of contracted volumes. Spot prices more than doubled. A Moody’s Ratings report warned that the disruption now threatens the semiconductor supply chains underpinning artificial intelligence and data center buildout — industries where companies have collectively committed roughly $725 billion in U.S. infrastructure spending this year on the assumption that the underlying supply chain holds. Helium is used in multiple critical stages of chip fabrication — wafer cooling during etching, as a carrier gas, and for leak detection — and no effective substitutes exist at industrial scale. South Korean chipmakers Samsung and SK Hynix entered the shortage with enough inventory to last through roughly June, but liquid helium can only be maintained in containers for about 45 days before it begins to degrade. The clock is structural, not just financial.⁶
The co-product architecture means that fossil fuel production is not a set of independent product lines. It is a coupled system. When a supply disruption reduces crude oil refining, it does not just cut gasoline — it simultaneously reduces the availability of diesel, jet fuel, asphalt, lubricants, and the petrochemical feedstocks that feed into medicine, agriculture, and construction. When natural gas supply contracts, it does not just raise heating bills — it constrains fertilizer production, helium supply, and the hydrogen used in dozens of industrial processes. The outputs are physically linked. A disruption that hits one hits all of them.
The Petrochemical Web
Before the Strait of Hormuz closed, approximately 20 million barrels per day of crude oil and petroleum products transited the waterway — roughly 20% of global petroleum liquids consumption and about 34% of all seaborne crude oil trade. It also carried approximately 19–20% of the world’s liquefied natural gas trade. As of this writing, daily liquid-cargo crossings through the Strait have fallen more than 90% from pre-war levels, from roughly 50 per day to single digits. Crude and product exports through the Strait averaged 2.3 million barrels per day in March — nearly 90% below the pre-war February level of 18 million barrels per day. Wood Mackenzie estimates approximately 11 million barrels per day of Middle Eastern crude production has been taken offline. The IEA coordinated the largest strategic petroleum reserve release in its history — 400 million barrels — on March 11. At maximum drawdown rates, that provides roughly 3.3 million barrels per day. The math is straightforward: the reserves buy time, but they cannot replace the volume. The net shortfall, after accounting for pipeline bypasses through Saudi Arabia and the UAE, remains in the range of 10 million barrels per day.⁷
The immediate coverage of this disruption has focused overwhelmingly on gasoline prices and headline crude benchmarks. That framing captures a fraction of what is at stake. Only about 40–45% of a barrel of crude becomes gasoline. The rest — roughly 55–60% — becomes diesel, jet fuel, heating oil, asphalt, lubricants, petroleum coke, and the hydrocarbon feedstocks that enter the petrochemical supply chain. The roughly 10–12% of each barrel that enters that chain shows up in nearly every manufactured good in the modern economy. The products it becomes are largely invisible to consumers — until they become scarce.
Medical supplies represent one of the most critical vulnerabilities. IV bags, syringes, surgical tubing, examination gloves, surgical drapes, medication blister packs, pharmaceutical capsules, prosthetic components, and diagnostic device housings are all manufactured from petroleum-derived polymers. Medical-grade resins require specific formulations — they cannot simply substitute commodity-grade plastics. These products have thin inventory buffers by design, because sterility imposes shelf-life constraints that prevent large stockpiling. In a supply disruption, medical-grade polymers compete for the same feedstock base as packaging, automotive, and construction applications, and because medical-grade production carries lower margins than many industrial uses, it is disproportionately vulnerable to being crowded out when total supply contracts.
The fragility of this supply chain is not theoretical. In September 2024, Hurricane Helene flooded Baxter International’s North Cove manufacturing plant in Marion, North Carolina — a single facility that produced roughly 60% of the intravenous fluid used by U.S. hospitals, approximately 1.5 million bags per day.⁸ One plant, one weather event, and the nationwide IV supply collapsed. A Premier Inc. survey of more than 220 healthcare providers found that 86% experienced IV fluid shortages within two weeks of the closure, with 54% reporting ten days or less of supply remaining. Hospitals postponed elective surgeries, rationed fluids to critical patients, and in some cases substituted oral Gatorade for intravenous hydration. The FDA authorized emergency imports of 23 IV and dialysis fluid products from Baxter’s overseas facilities. The shortage persisted for nearly ten months — the FDA did not declare it resolved until August 2025.⁹ The cause was a flood, not a petrochemical supply disruption. But what the flood revealed was a medical supply chain built on petroleum-derived polymers, concentrated in a handful of production facilities, with inventory buffers measured in days — serving a healthcare system that has no ability to substitute when supply is interrupted.
The petroleum dependency extends beyond the material a device is made from. Ethylene oxide — a petrochemical derivative produced from ethylene, itself extracted by steam-cracking petroleum or natural gas — is used to sterilize approximately 50% of all medical devices in the United States, more than 20 billion devices annually. Heart valves, pacemakers, surgical kits, catheters, ventilators, syringes, gowns, and drapes all require sterilization before reaching a patient. For many of these devices, ethylene oxide is the only sterilization method that works — it penetrates complex geometries and multiple packaging layers without damaging sensitive materials in ways that heat, steam, or radiation cannot. A peer-reviewed study published in the American Journal of Infection Control concluded that no alternative to ethylene oxide currently provides the same sterility assurance and device performance, and that it is likely irreplaceable for years.¹⁰ The EPA itself, in a March 2026 rulemaking proposal, acknowledged that ethylene oxide sterilization has “no viable alternative on the market” at current scale.¹¹ This means the petroleum dependency in healthcare is double-layered: the polymer the device is built from and the chemical process that makes it safe to use both trace back to the same hydrocarbon feedstock.
Construction materials carry deep petroleum exposure at every stage: asphalt for roads and roofing, PVC pipe and fittings, insulation foam, roofing membranes, sealants and adhesives, paint (petroleum solvents and petroleum-derived resins), vinyl siding, carpet backing, and house wrap. Even concrete production requires energy-intensive kiln firing, where natural gas is the primary fuel in most facilities. These inputs trace back to the same naphtha and natural gas feedstocks described in the co-product architecture — when that feedstock base contracts, construction material costs spike across multiple categories simultaneously, not sequentially, because they share a common upstream source.
Agriculture is petroleum-dependent at virtually every node in the production chain, extending far beyond the fertilizer dependency already discussed. Walk through the lifecycle of a single crop: natural gas provides both the energy and the hydrogen feedstock for nitrogen fertilizer; petroleum provides diesel for tractors, combines, harvesters, and irrigation pumps; petroleum-derived chemicals serve as active ingredients and carrier solvents in pesticides and herbicides; plastic mulch film, drip irrigation tubing, and grain storage bags are all petroleum products; packaging at every stage from field to retail shelf is petroleum-derived; and every truck, train, and ship in the distribution chain burns petroleum-based fuel.
The caloric arithmetic is striking. By the time food reaches an American table, the full production chain — cultivation, processing, transportation, and retail — has consumed an estimated 7 to 13 calories of fossil fuel energy for every 1 calorie of food energy delivered.¹² That ratio has been climbing for decades as mechanization, synthetic fertilizer intensity, and supply chain complexity have increased. This is not inherently a crisis — the system is extraordinarily productive. The Green Revolution of the 1950s–1970s — the agricultural transformation driven by high-yield crop varieties, synthetic nitrogen fertilizer, and mechanization that enabled world population growth from roughly 3 billion to 8 billion — was built on exactly this energy intensity. It fed billions of people who would otherwise not have survived. But it means the food system’s vulnerability to fossil fuel disruption is total and correlated. When petrochemical inputs become scarce or expensive at multiple nodes simultaneously, the system does not experience isolated failures. It experiences correlated stress across the entire production chain.
The same feedstock base shows up in clothing, automotive components, electronics, cleaning products, and packaging of virtually every type. The dependency is comprehensive.
A Barrel Is Not a Barrel
The co-product problem is compounded by a second structural reality that most energy analysis overlooks: crude oil is not a commodity in the way that corn or copper is. Not all barrels are interchangeable.
Crude oil varies dramatically in two properties that determine what a refinery can produce from it: density (measured by API gravity — “light” versus “heavy”) and sulfur content (“sweet” versus “sour”). Light sweet crude, like West Texas Intermediate from the Permian Basin, is easier to refine and yields more gasoline and lighter distillate products. Heavy sour crude, like Venezuelan Merey or Canadian Western Canadian Select, requires more complex processing through specialized equipment — cokers, hydrocrackers, desulfurization units — but produces proportionally more diesel, jet fuel, and asphalt. These are products where demand is often most inelastic, because they serve transportation and infrastructure functions with few short-term substitutes.
The differences between grades are not minor. Refineries are purpose-built for specific crude chemistry profiles, with billions of dollars in specialized equipment optimized for a particular feedstock range. A refinery configured for heavy sour crude cannot efficiently process light sweet crude without significant yield penalties and operational compromises, and vice versa.
This creates a situation that confuses most observers. The United States is the world’s largest crude oil producer, yet it simultaneously exports light sweet crude and imports heavy sour crude. This is not a policy failure, a market inefficiency, or evidence that “energy independence” is a myth that serves political messaging. It is chemistry. A significant portion of U.S. Gulf Coast refining capacity was purpose-built over decades to process heavy sour crude from Venezuela, Mexico, Saudi Arabia, and Canada. The shale revolution made the U.S. the world’s largest producer of light sweet crude — a fundamentally different product with different refining characteristics and different output profiles.
When a supply disruption hits a specific crude grade — as geopolitical conflict, sanctions, or infrastructure failure periodically does — domestic production of a different grade cannot fill the gap without massive refinery reconfiguration that takes years and billions in capital investment. The fungibility that most market commentary assumes simply does not exist at the level where supply meets refining capacity meets end-product demand.
The spreads between grades — light-heavy differentials, sweet-sour differentials — are where the actual supply-demand signals live. Those spreads can move dramatically during disruptions even when headline benchmark prices appear stable. Analysts and commentators who report only the WTI or Brent headline number are giving you the weather in one city and calling it a national forecast.
This matters now because the crude transiting the Strait of Hormuz is not interchangeable with the crude the United States produces. Gulf crude is disproportionately medium-to-heavy sour — the feedstock that a significant share of U.S. Gulf Coast refining capacity was purpose-built to process. When roughly 25% of the world’s seaborne oil is removed from the market, the question is not whether total global production can theoretically offset the loss. It is whether the specific grades that specific refineries need can reach them through alternative routes, at volumes that matter, on a timeline that matters. For most of the affected crude, the answer is no.
When the Platform Contracts
The co-product architecture and the grade-specificity problem converge into a single structural reality: when fossil fuel supply contracts — whether by geopolitical disruption, infrastructure failure, or any other cause — the consequences extend far beyond the fuels that dominate the headlines.
Demand for combustion fuels can adjust, at least partially. People drive less. Shipping companies reroute. Airlines cut schedules. These are painful adjustments, but they are adjustments — the market has some elasticity. Demand for the non-combustion co-products does not adjust in the same way. Hospitals do not use fewer IV bags because oil is expensive. Farmers do not stop needing fertilizer because a shipping lane is closed. Semiconductor fabs do not pause production voluntarily when helium prices double — they run until they physically cannot source the inputs, and then they stop. The demand is structurally inelastic. It does not decline because prices rise. It holds until supply physically runs out.
This creates a dynamic that most economic models of supply disruption fail to capture. When total fossil fuel throughput declines, the combustion fuels and the platform co-products are competing for shares of a shrinking pie. The fuels get the headlines and the political attention. The co-products — fertilizer feedstocks, medical-grade polymers, petrochemical intermediates, helium — get rationed quietly, and the downstream consequences show up weeks or months later in places that appear to have no connection to energy markets. Crop yields decline. Medical device availability tightens. Construction costs spike. Chip lead times extend. Each is reported as its own story. The common cause — a contraction in the platform that supplies all of them — is visible only if you are tracking the co-product architecture that this article describes.
The economies of scale that drove fossil fuel costs down over decades of expanding production run in reverse when throughput declines. Fixed infrastructure costs are spread across fewer barrels. Maintenance becomes harder to schedule. Specialized labor and equipment cannot be idled and reactivated on demand. The cost curve steepens, and the products at the margins of the system — the co-products with lower individual revenue but critical downstream importance — are the first to become scarce or prohibitively expensive.
The recovery timelines compound the problem. The disruption curve is not symmetrical — systems break fast and rebuild slow. The timelines already documented in this article illustrate the pattern: Baxter’s single IV fluid plant took ten months to restore after a flood. The FDA took nearly as long to resolve the resulting shortage. Qatar’s damaged LNG trains face an estimated three to five years of repair. Samsung and SK Hynix entered the supply squeeze with helium inventory measured in weeks, constrained by the physical reality that liquid helium degrades in containers after roughly 45 days. These are not soft timelines governed by market incentives — they are hard timelines governed by engineering, physics, and the revalidation requirements of sterile and precision manufacturing. A fertilizer plant that shuts down for lack of feedstock does not restart the day gas arrives. A refinery that loses its crude slate cannot reconfigure in months. The implication is that even after the geopolitical disruption resolves, the downstream consequences will persist on their own industrial clocks.
What This Means
Fossil fuels are not just fuel. They are the production platform beneath modern agriculture, medicine, construction, manufacturing, and the semiconductor supply chains that increasingly define economic and military capability. When that platform is disrupted, the consequences do not stay in the energy sector. They propagate — through co-product dependencies, feedstock competition, and grade-specific refining constraints — into domains that most observers do not associate with oil and gas.
The Strait of Hormuz closure is stress-testing every link in this system simultaneously. The price at the pump is the most visible effect. It is not the most consequential one. The fertilizer shock hitting planting season, the helium shortage threatening chip fabrication, the petrochemical feedstock constraints flowing into medical supply and construction costs — these are the consequences that will compound over the coming months in ways that the headline energy coverage does not prepare anyone to anticipate.
The Future Isn’t Written
This section is offered with a direct acknowledgment: I am not an economist, an atmospheric scientist, an agricultural policy expert, or a petroleum engineer. I am a financial advisor who followed the data across domains that are typically analyzed in isolation. The connections I have documented are sourced, but the conclusions I draw from them are my own — informed by research, not by institutional authority within any single field. There may be solutions, resources, or adaptive mechanisms that my research did not uncover or underappreciated — niche technologies scaling faster than public data reflects, regional supply arrangements operating below the threshold of national reporting, or institutional responses that have not yet been announced. I do not know what I do not know.
What I do know is that humans adapt under pressure, and they tend to do so faster than models predict. The structural dependencies described in this article are real. So is the historical record of adaptation.
The most relevant precedent may be Europe’s response to losing Russian gas. In 2021, the European Union imported 155 billion cubic meters of Russian natural gas — roughly 45% of its total gas imports. When Russia weaponized that dependency after invading Ukraine, experts warned of economic catastrophe. What followed instead was what one analysis called “a massive adaptation of the energy system.”¹³ Germany, which had no LNG import terminals before the crisis, built its first floating terminal in nine months. European gas consumption fell more than 18% in 2022 and 2023 compared to the previous five-year average. By October 2022, EU gas storage was at 90% capacity. Prices remain above pre-crisis levels and some industrial users permanently reduced output — the adaptation was not painless — but the catastrophe that was predicted did not materialize.¹⁴
The current disruption differs from Europe’s gas crisis in important ways. Europe could replace Russian pipeline gas with LNG from Qatar, the United States, and Australia. The Hormuz closure removes one of those very sources. There is less slack in the system and fewer alternative suppliers to draw from. But the behavioral pattern — shortages of critical resources drives adaptation faster than anyone models — is documented and real.
The global oil system has spare capacity that was being voluntarily withheld — and the structure constraining it just cracked. OPEC’s surplus crude oil production capacity was 4.6 million barrels per day in 2024 — more than double the level in 2019.¹⁵ On May 1, 2026, the United Arab Emirates withdrew from OPEC and OPEC+ entirely, effective immediately. The UAE had grown its production capacity to 4.8 million barrels per day but was only allowed to produce 3.2 million under its OPEC quota — 1.6 million barrels per day of capacity held back by agreement, not geology. UAE Energy Minister Suhail Mohamed al-Mazrouei stated that “the decision to be outside any constraint is something that is important for us to ensure that we are attaining at the market condition, at the right time and at the right pace.” The UAE has committed to investing $145 billion in its domestic upstream oil sector over ten years, with the goal of expanding capacity to 5 million barrels per day by 2027.¹⁶ Wood Mackenzie assessed that the UAE’s near-term production is constrained by the Hormuz closure — close to 2 million barrels per day of offshore production is currently shut in — but once transit resumes, the UAE’s ability to take a growing share of global demand in 2027 and beyond is significant. Non-OPEC production is also growing: Canada, Guyana, and Brazil are each adding hundreds of thousands of barrels per day of new capacity through 2026, with Guyana’s massive offshore reserves operated outside any production agreement.¹⁷ The grade-specificity constraints described earlier in this article still apply — not all of this crude is interchangeable with what transited the Strait — but the physical oil exists and can be produced. Whether and how quickly it reaches the market depends on political decisions and conflict resolution, not geological ones.
Demand destruction is a real adjustment mechanism for combustion fuels, and it is already operating. When energy prices rise, people drive less, consolidate trips, and shift toward more fuel-efficient vehicles. Airlines cut routes. Industrial users find efficiencies. The World Bank estimates that global oil consumption fell by 0.8 million barrels per day year-over-year in March 2026 as prices rose.¹⁸ This is painful for households but it is the market functioning — demand falling toward reduced supply rather than supply physically running out. The price mechanism is brutal but it prevents the absolute scarcity that the most alarming reading of the platform disruption might suggest.
Demand destruction provides less relief, however, for the structurally inelastic co-products this article has focused on: fertilizer, medical polymers, helium, and petrochemical feedstocks. Demand for these inputs does not decline because prices rise — hospitals do not use fewer IV bags, farmers do not stop needing fertilizer, and semiconductor fabs do not voluntarily pause production. The price mechanism that adjusts combustion fuel consumption does not operate on these products in the same way. They are rationed by availability, not by price.
The United States remains a net food surplus nation — and Americans waste roughly 70 million tons of food per year. American agriculture produces substantially more than domestic consumption requires, with roughly 20–25% of output exported. When input-cost push food prices significantly higher, reduced exports function as a domestic buffer before physical scarcity becomes a realistic concern. The 2012 drought reduced corn yields by 27% and was absorbed by the domestic food system through price increases, not shortages. The current disruption is more structurally complex than 2012 because it is globally correlated — all Northern Hemisphere producers face elevated fertilizer costs simultaneously, and American farmers sell into global markets where foreign buyers bid against domestic purchasers. But the physical surplus exists.¹⁹
The waste reduction potential compounds that buffer. The United States generates roughly 70 million tons of surplus food annually. During the pandemic, behavioral change alone — less eating out, more careful shopping, less impulse purchasing — reduced food waste by approximately 18 million tons in a single year, a 25% decline.²⁰ During the Great Recession, households shifted to cheaper brands, ate out less, and shopped more carefully, stretching available food further without any reduction in caloric intake.²¹ That behavioral slack is real and gets activated by price signals without requiring policy intervention. The pain arrives as higher grocery bills — potentially significantly higher — before it arrives as empty shelves. The distinction matters.
Weather variability works in both directions. The western drought described later in this series is severe by any modern measure. But climate is variable, and a single strong precipitation year can materially improve reservoir storage and snowpack. In the winter of 2022–23, a series of storms brought Rocky Mountain snowpack to 150% of average in the Upper Colorado Basin. Colorado went from nearly 100% drought coverage to effectively drought-free within a single water year. Lake Powell received 144% of average inflows and recovered meaningfully. Blue Mesa Reservoir went from 36% full to 71% in one season.²² A good year provides breathing room, not resolution — one wet winter did not erase a 23-year drought, and the structural water commitments that exceed available supply persist regardless of precipitation. But the catastrophic water timeline has genuine uncertainty in both directions.
State governments have policy tools the federal government is not currently deploying. While the federal policy direction in 2025–2026 has been toward fiscal contraction in agricultural support, healthcare, and disaster preparedness, state governments retain independent authority over emergency declarations, water allocation, energy regulation, utility rate structures, and targeted relief programs. States with significant agricultural sectors, petrochemical infrastructure, or water constraints have both the incentive and the constitutional authority to act independently. What specific actions states will take — and whether those actions will be sufficient to materially buffer the disruptions described in this series — is genuinely uncertain and not something this analysis can predict.
Aggregate data can overstate severity as easily as it can understate it. The average U.S. household net worth is approximately $1.06 million; the median — the point where half of households have more and half have less — is roughly $192,900.²³ A report citing the average would describe a country of millionaires. The median describes something most people would actually recognize. The same distortion operates across any data set where a skewed distribution compresses into a single number. The national home-price-to-income ratio — median home price divided by median household income — is 5.08. In Pittsburgh, it is 3.07. In San Jose, it is 11.65.²⁴ The national figure understates how severe affordability is in coastal California by more than half, while overstating it in the Midwest by roughly two-thirds. If that national ratio then feeds into downstream analysis — projected household cost burdens, construction demand forecasts, consumer spending estimates — it can make the national picture look worse than what most households experience, while simultaneously underrepresenting the severity in the regions hit hardest. The structural dependencies documented in this article are real, but the lived experience of any individual household will be shaped by geography, income, occupation, and choices that national data cannot capture.
The co-product architecture is real. The grade-specificity constraints are real. The downstream propagation into agriculture, medicine, construction, and manufacturing is real and documented. What is uncertain is duration, severity, and the degree to which adaptive mechanisms — diplomatic, meteorological, economic, political, and behavioral — compress the impact. The historical record says that these mechanisms work. It also says they take time, that the costs of adjustment are not evenly distributed, and that the people with the least margin absorb the most pain while the system finds its footing. The range of outcomes is wide. Readers should evaluate the evidence and make decisions based on the range, not on either endpoint.
Notes
- IEA Global Hydrogen Review 2025. Low-emissions hydrogen accounts for less than 1% of global production. Approximately 95 million tonnes of hydrogen produced annually worldwide, roughly 95% from fossil fuels without carbon capture.
- Erisman, J.W., Sutton, M.A., Galloway, J., Klimont, Z., & Winiwarter, W. (2008). “How a century of ammonia synthesis changed the world.” Nature Geoscience, 1(10), 636–639.
- Ritchie, H. (2017). “How many people does synthetic fertilizer feed?” Our World in Data. ourworldindata.org/how-many-people-does-synthetic-fertilizer-feed
- Fertilizer disruption data synthesized from: Carnegie Endowment for International Peace, “Fertilizer isn’t getting through the Strait of Hormuz,” April 3, 2026; farmdoc daily (University of Illinois), “Strait of Hormuz Closure and Fertilizer Supply Risks for U.S. Agriculture,” March 24, 2026 (urea price surge of 28% within three weeks); CNBC, “Fertilizer prices surge amid Iran war,” March 25, 2026 (Egyptian granular urea at $700/MT, up from $400–490); Rystad Energy analysis cited in OilPrice.com (21% of global urea trade and 15% of ammonia trade exposed to Hormuz closure); Democracy Now interview with Adam Hanieh, April 23, 2026 (one-third of world’s basic fertilizers transit the strait). QatarEnergy force majeure and LNG train damage from multiple sources including QatarEnergy CEO statements reported by Reuters. Fertilizer plant shutdowns in India, Bangladesh, Pakistan, and Egypt from Carnegie Endowment.
- U.S. Geological Survey, Mineral Commodity Summaries: Helium. Published annually. usgs.gov
- Helium disruption data synthesized from: Fortune, “The AI economy runs on helium. The Iran war just created a $725 billion problem,” April 22, 2026 (Moody’s Ratings report, $725 billion hyperscaler commitment, Samsung/SK Hynix inventory through June, 45-day liquid helium container degradation); Foreign Affairs Forum, “The Hormuz Hit to Helium,” April 28, 2026 (30–33% of global helium supply removed, spot price surge to $600–900/Mcf); Axios, “Iran war deflates critical helium production supplies,” April 7, 2026 (Airgas force majeure, 50% customer allocation); Caixin Global, “Qatar Helium Shutdown Adds New Risk to Chip Supply Chain,” March 16, 2026 (30% of global helium supply disrupted, helium role in EUV lithography and wafer thermal management); AGBI, “Qatari LNG shutdown puts 11% of global helium supply at risk,” March 2026.
- Strait of Hormuz transit and disruption data synthesized from: U.S. Energy Information Administration, “Amid regional conflict, the Strait of Hormuz remains critical oil chokepoint” (20 million bpd normal transit, 20% of global petroleum liquids consumption); IEA Strait of Hormuz briefing (15 mb/d crude oil, 34% of global crude trade, 19% of global LNG trade); Oxford Institute for Energy Studies, “The Anatomy of the Strait of Hormuz Oil Shock,” April 2026 (daily crossings down >90%, March exports at 2.3 mb/d vs. 18 mb/d pre-war); Wood Mackenzie analysis (11 million bpd Middle Eastern production offline); Kpler, “Iran war and the Strait of Hormuz: Oil market implications six weeks in,” April 7, 2026 (export volumes fallen from 15 to 7 million bpd); IEA announcement of 400 million barrel coordinated SPR release, March 11, 2026; LSE Business Review, March 12, 2026 (net shortfall calculation after pipeline bypasses); Congressional Research Service R45281 (pipeline bypass capacity of approximately 2.6 million bpd per EIA).
- Baxter International, Hurricane Helene Summary page (updated May 13, 2025). North Cove is Baxter’s largest U.S. manufacturing plant; production share of approximately 60% of domestic IV fluid supply confirmed by the American Hospital Association and the U.S. Department of Health and Human Services. Production volume of approximately 1.5 million bags per day reported by AMA and AHA.
- Premier Inc. survey of 220+ healthcare providers, October 7–8, 2024; STAT News, “How hospitals are grappling with the IV fluid shortage wrought by Hurricane Helene,” October 9, 2024; FDA statement resolving sodium chloride 0.9% shortage, August 8, 2025. Hospitals postponing surgeries reported by Premier (17% of respondents) and additional 58% considering postponement; oral hydration substitutes reported by STAT News.
- Rutala, W.A. and Weber, D.J. (2023). “Sterilization of 20 billion medical devices by ethylene oxide (ETO): Consequences of ETO closures and alternative sterilization technologies/solutions.” American Journal of Infection Control, 51(11), e145–e157. EtO sterilizes approximately 50% of all medical devices (~20 billion units annually) per Gamma Industry Processing Alliance and International Irradiation Association data cited therein; AdvaMed congressional testimony.
- U.S. Environmental Protection Agency, proposed amendments to NESHAP for Ethylene Oxide Commercial Sterilization Facilities, March 13, 2026. Ethylene oxide feedstock chain (ethylene from steam cracking of petroleum/natural gas naphtha) from ChemAnalyst and Petrochemicals Europe. Trump administration Executive Order extending EtO compliance deadlines issued July 17, 2025, citing medical device supply chain risks.
- Estimates vary by study, crop type, and system boundary. The range of 7–13 fossil fuel calories per food calorie encompasses farm-gate production through retail delivery. The foundational work is Pimentel, D. & Pimentel, M., Food, Energy, and Society (3rd ed., CRC Press, 2008), which documents ratios of approximately 3:1 for on-farm production alone, rising to 10:1 or higher when processing, transportation, and retail are included. The 10:1 figure was subsequently popularized by Michael Pollan and is consistent with USDA Economic Research Service food system energy analyses. A 2024 study published in Proceedings of the National Academy of Sciences (Galán-Martín et al.) modeled global agri-food system energy return on energy investment and found that high-income food systems are net energy sinks, with food processing alone accounting for 40% of total energy use. Darrin Qualman’s analysis of Pimentel data estimates 13.3 fossil fuel calories per food calorie consumed in North America when food waste is included.
- Brookings Institution. “Europe’s Messy Russian Gas Divorce” (March 11, 2025). Characterization of European adaptation as “a massive adaptation of the energy system” attributed to Alexandra Gritz and Guntram Wolff, German Council on Foreign Relations. Germany’s first floating LNG terminal built in nine months; natural gas demand decreased approximately 20% from July 2022 to March 2023 (industry 26%, households 17%).
- European Council. “The Energy Leap: How EU Countries Weathered a Russia-Induced Crisis and Are Reshaping Energy Supply” (2024). EU gas storage at 90% capacity by October 2022. Gas consumption fell more than 18% in 2022 and 2023 compared to previous five-year average. European Council on Foreign Relations. “Conscious Uncoupling: Europeans’ Russian Gas Challenge in 2023” (November 29, 2024). EU LNG imports surged approximately 60% year-over-year in 2022; Russia’s share of total EU gas imports fell from 45% to less than 15% by 2023.
- U.S. Energy Information Administration. “Petroleum Liquids Supply Growth Driven by Non-OPEC+ Countries in 2025 and 2026” (February 13, 2025). OPEC surplus crude oil production capacity of 4.6 million bpd in 2024, 103% above 2019 levels. Saudi Arabia produced 9.0 million bpd in 2024, down 1.4 million bpd from 2022 due to voluntary OPEC+ cuts.
- Al Jazeera. “UAE Quits OPEC: What That Means for the Gulf, Energy Markets and Beyond” (April 29, 2026). UAE capacity at 4.8 million bpd, quota at 3.2 million bpd. UAE Energy Minister quoted in Gulf News (April 28, 2026) and CNBC. Wood Mackenzie. “UAE’s Exit Rattles OPEC’s Grip on the Oil Market” (May 2026): 2 million bpd shut in, $145 billion upstream investment commitment, capacity target of 5 million bpd by 2027. UAE withdrawal effective May 1, 2026, per state media via WAM.
- U.S. Energy Information Administration (February 2025). Forecast production growth 2024–2026: Canada 0.5 million bpd, Guyana 0.3 million bpd, Brazil 0.3 million bpd. Guyana’s Stabroek block development (Yellowtail, Uaru, Whiptail projects) expected to reach approximately 1.3 million bpd combined capacity by end of 2027.
- World Bank commodity market analysis (March 2026). Global oil consumption fell 0.8 million barrels per day year-over-year in March 2026 due to increased disruptions and higher prices.
- U.S. food exports represent roughly 20–25% of agricultural output per USDA Economic Research Service data. The 2012 drought impact on corn yields (27% reduction) absorbed through price increases from USDA historical data. U.S. food imports account for approximately 15% of total food and beverage purchases per USDA ERS Food Dollar Series (2023); 85% produced domestically.
- ReFED. “Progress on the Plate: 2026 US Food Waste Report” (April 7, 2026). Total surplus food generation reached 74.6 million tons in 2019, dropped to 56.4 million tons in 2020 (pandemic-driven behavioral change), rose to 71.6 million tons in 2023, and declined to approximately 70 million tons in 2024 — a 2.2% reduction and the first meaningful decline since the pandemic dip.
- Chicago Booth Review. “How the Great Recession Changed US Shopping Habits” (undated), citing Cha, Chintagunta, and Dhar research using consumer-packaged-goods data from 60,000 U.S. households, 2007–2009. Consumers switched to cheaper brands and discount retailers. NBER Digest (October 2015). “Food Shopping Behavior During the Great Recession”: households devoted more time to shopping for better deals as unemployment rose. Choices Magazine. “Consumer Food Buying During a Recession” (2020): total household food spending fell 7% from 2007 to 2010, not fully recovering until 2015, driven primarily by reduced spending on food away from home.
- Colorado drought-to-recovery data from Bureau of Reclamation operations reports and NIDIS/Drought.gov monitoring. Upper Colorado Basin snowpack at 150% of average, winter 2022–23. Lake Powell inflows at 144% of average. Blue Mesa Reservoir from 36% to 71% capacity. Bureau of Reclamation reduced Colorado River shortage tier from Tier 2a to Tier 1 for 2024.
- Federal Reserve Board, Survey of Consumer Finances (2022). Average (mean) household net worth of $1,063,700 and median household net worth of $192,900. The SCF is conducted triennially and is the most comprehensive source for U.S. household wealth data. The 2025 wave is currently in the field, with results expected in late 2026.
- Best Interest Financial, “Home Prices vs. Income Analysis,” February 2026, using U.S. Census Bureau American Community Survey (2024) median household income data and National Association of Realtors existing single-family home sales data (Q4 2025). National median home price of $414,900 divided by median household income of $81,604 produces a national ratio of 5.08. Metro-level ratios: Pittsburgh 3.07 (median home price $237,400, median income $77,214); San Jose 11.65 (median home price $1,920,000, median income $164,801). The recommended affordability threshold is a ratio of 2.6 or below; none of the 50 most populous U.S. metros meets this threshold.
Material created in part with the assistance of AI. The foregoing information has been obtained from sources considered to be reliable, but we do not guarantee that it is accurate or complete, it is not a statement of all available data necessary for making an investment decision, and it does not constitute a recommendation. Any opinions are those of Mississippi Sound Financial Planning, LLC. and not necessarily those of Raymond James.